2023 Review

11 January 2024

2023 Review


After the turbulence of 2022, we saw some large steps back to the path of normality in 2023. The inflated energy prices that had threatened many UK businesses in ’22 slowly subsided, and while they haven’t quite gone back to the levels we saw in the previous decade, they have seemed to head in the right direction.

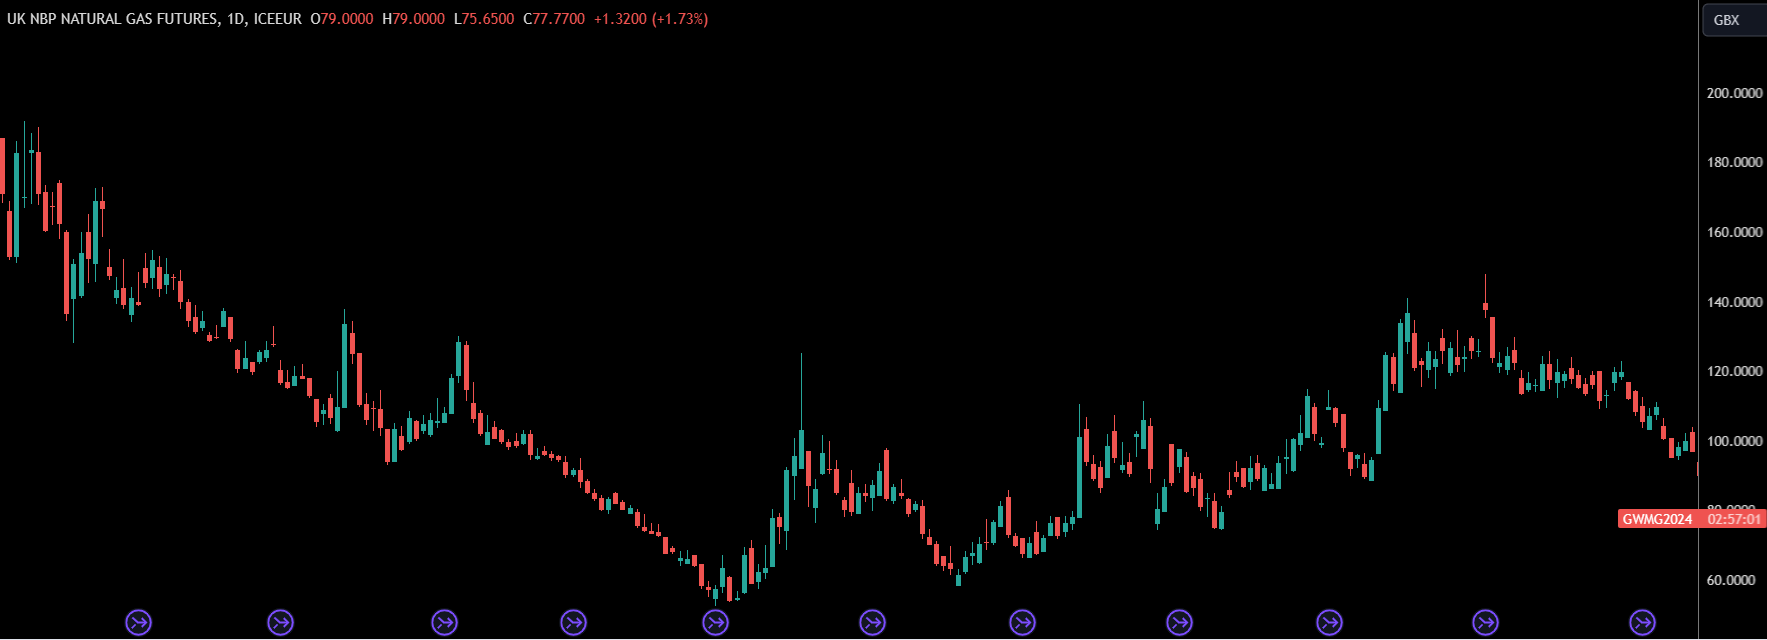
The 2023 wholesale gas chart


Quarter 1

As the year began, Day Ahead (DA) gas was priced at 166.9p/therm, and the DA electricity price was £163.45/MWh. This was significantly below the peaks of 2022, but still far above historical levels. The Energy Bill Relief Scheme (EBRS) was taking some pressure off of businesses; however this was due to expire on March 31st. Worries of how businesses would cope post-EBRS were lessened as prices fell consistently throughout the first 3 months of the year. 

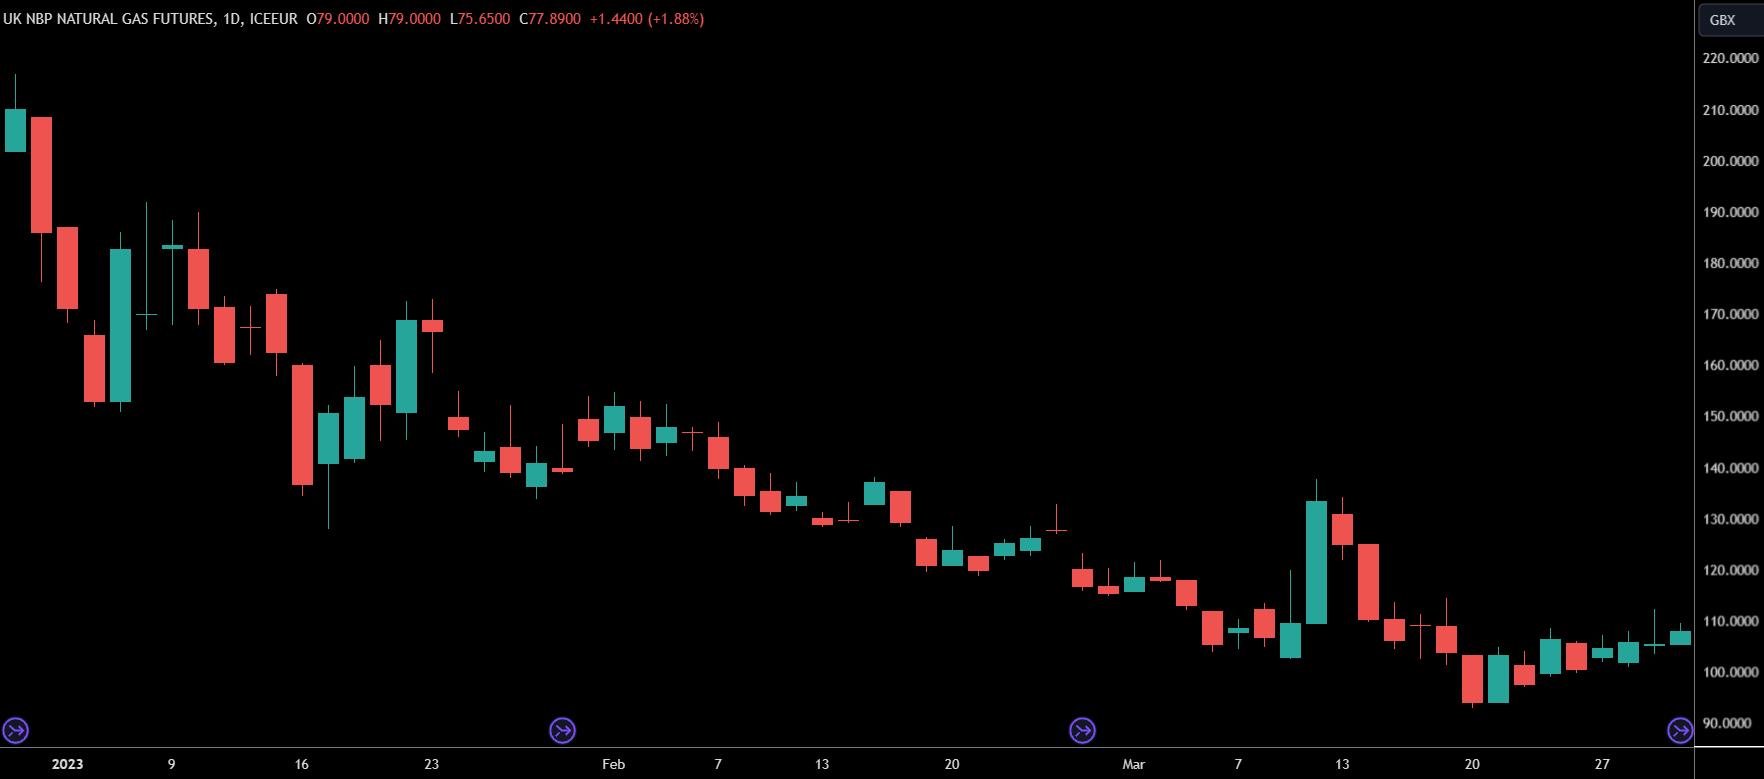
The Q1 wholesale gas chart

A milder than expected winter had led to consumption levels being below historical averages and thus avoiding the potential gas shortages which had been extensively written about. However, there were some shortages experienced as supermarket shelves looked uncharacteristically bare. Frost in Morocco and Spain had led to shortages of vegetables and – due to the high electricity cost – it was deemed not viable to make up for the shortfall using greenhouses.


After February, fears still remained surrounding gas prices and whether they would revisit their 2022 highs, at this time we wrote “With French nuclear energy returning, European storage levels at 65% (compared to 29% last year), and Germany completing construction of it’s floating LNG terminals, the outlook is significantly more positive than it was for most of 2022.” These factors did end up contributing to the falling prices.


By the end of the quarter DA gas prices had fallen to 106p/Therm, falling more than a third during the first quarter of the year. The electricity price had fallen a similar % to close the quarter at £109.70/MWh


Quarter 2

By April journalists and politicians were willing to speak about energy prices in a more positive context. Prices had continued falling and the narrative which had been dominated by pessimists in the previous months was beginning to show signs of optimism. However, the EBRS scheme was no longer providing support, and many businesses began to feel the pain of high unit rates even as wholesale prices continued to decline.


The Q2 wholesale gas chart


Ukraine, which had been key in the catalysts responsible for seeing energy prices hit unprecedented highs, began exporting electricity again, and by the end of the month we wrote:

“While there will still be risks and some caution around the gas supply ahead of next winter there is a shift in overall sentiment, with more public figures and institutions feeling comfortable enough to express their positive views. Without any negative catalysts emerging it seems likely that wholesale prices will steadily continue to drop until such a point that market confidence is interpreted as complacency.”


In May, some of the optimism which we saw in April began to be met with caution and hesitancy. OFGEM stated that they believed prices could remain high for the next 24 months and the market sentiment was suggesting we were about to see prices stabilise or head back up. At this time we stated:

 “with current wholesale prices being priced below future contracts. This shows that there is an expectation wholesale prices will rise ahead of Winter ‘23 and that we could be close to the yearly low.”


Despite these fears, the lowest gas and wholesale prices in 2023 were observed in May and early June. However, shortly after this, prices began to rise again. Disruptions to the supply of gas from Norway was seen as a key factor in these increasing prices, as well as the confirmed shutdown of gas fields in Groningen, removing one of Europe’s key contingency plans.


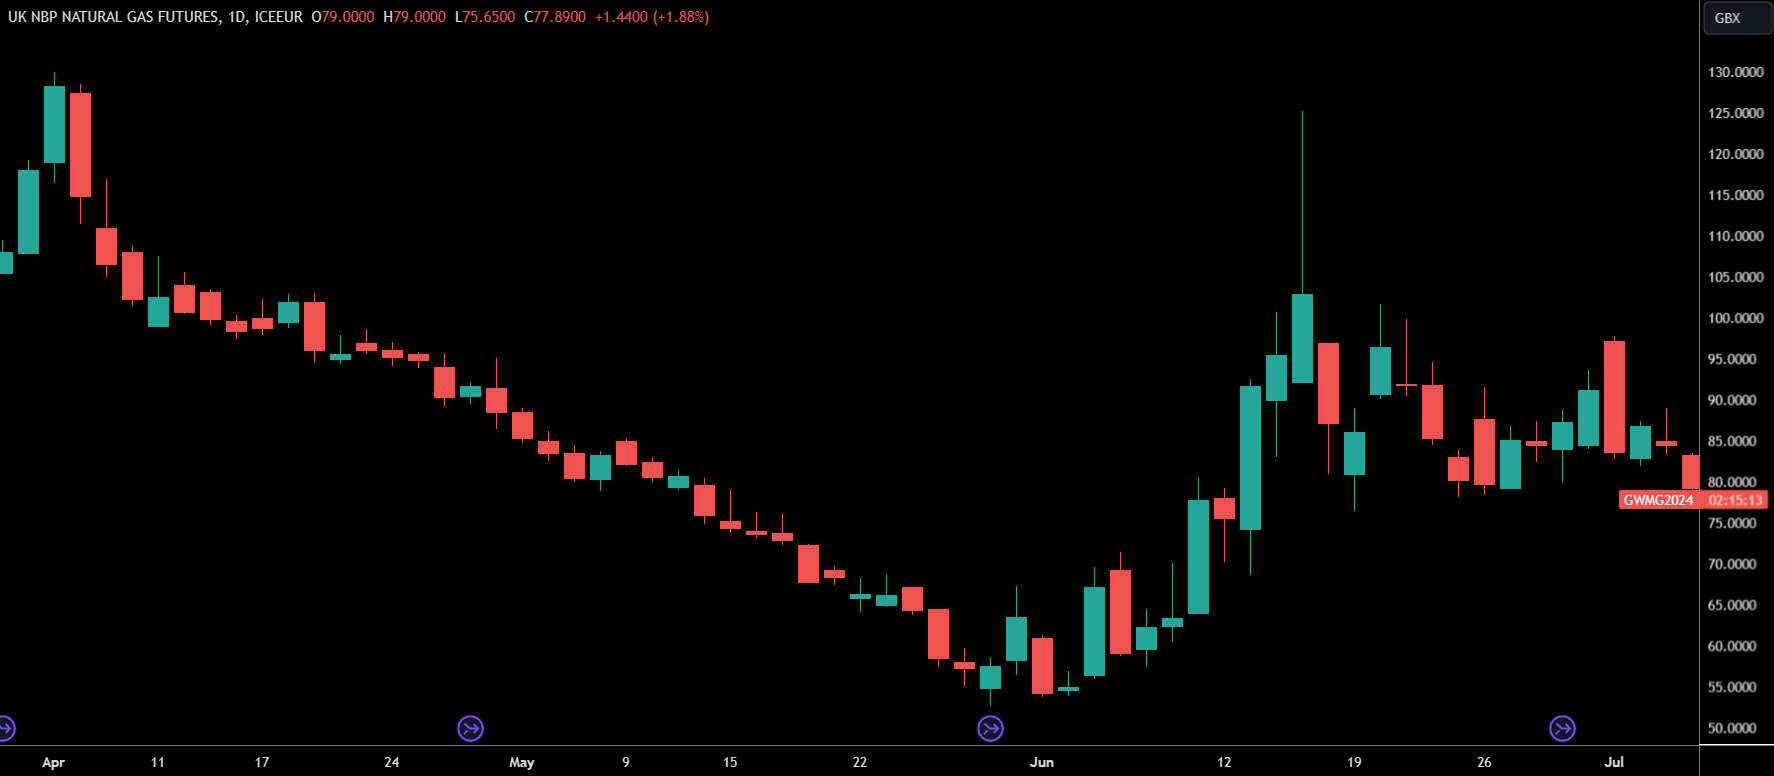
At the half way point of the year, DA gas prices were down to 92.6p/Therm, a decline of 12.5% during the 2nd quarter, despite being notably higher than the May lows where prices had dropped below 60p/therm. While DA electric prices had fallen to £85.83/MWh, representing an almost 50% drop since the start of the year.


Quarter 3


The Q3 wholesale gas chart


Quarter 3 saw a reversal in the trend of declining prices that had been established during the first 6 months of the year. Wholesale prices had already hit their yearly low in June, and for the remaining summer months they would slowly begin to rise.


By July, fears had started to emerge regarding the UK’s gas reserve capacity, with the market already looking forward to the winter ahead. Plans were considered to reopen disused gas storage facilities in addition to securing LNG imports for the coming months.

At the end of July we wrote:

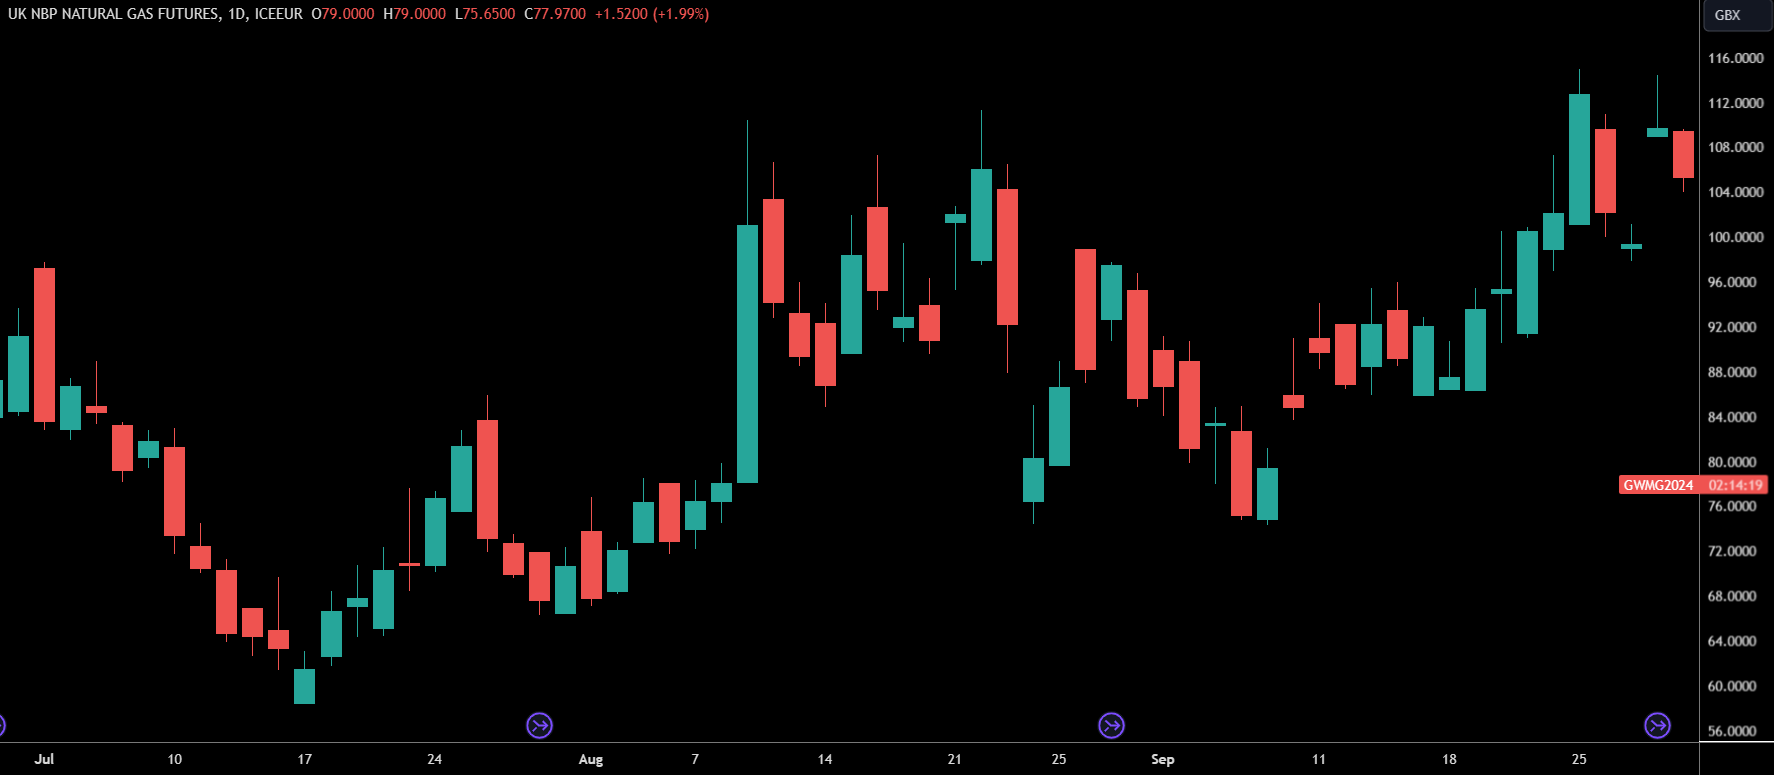
“As we start to edge closer to winter, it seems likely that concerns about supply for the winter of 2023 will increasingly drive the price narrative. With the failure to make a new low during July it now seems unlikely that wholesale prices will go below the low of May 30th and we are likely to see steady increases for the next few months.” - This proved to be the case, as prices failed to go below the levels seen at the end of July for the remainder of the year.


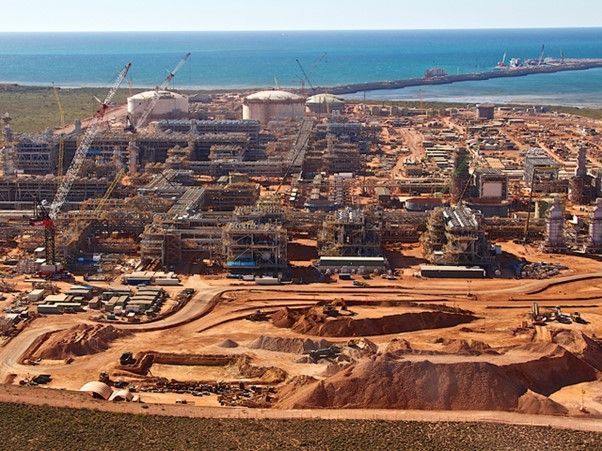
In August the energy news was dominated by the threats of industrial action at Australian Chevron plants. This threatened to disrupt global energy prices as fears of LNG shortages sent prices rising. Eventually a resolution was reached and disruptions were averted, but wholesale prices still rose almost 20% during the month.


September followed the trend of rising prices seen in the previous months as disruptions to Norwegian supply further impacted the wholesale markets. Prices rose to their highest level since April during the month before subsiding by the end of the month with DA gas prices ending the quarter at 96.7p/therm, representing a small increase from the levels seen at the end of June. DA electricity prices followed a similar trend, rising slightly since the end of June with a price of £90.01/MWh.

After prices had pulled back we said:
“we believe we have seen the market low for this year, and there are more factors that could send prices higher than factors which could see a return to the June lows. We still believe this to be the case, and that the most sensible approach would be for those on flex contracts to look at locking in a significant % of their winter demand.” - As we headed into October, prices would soon see more significant rises.


Quarter 4

Hostilities in Israel caused a sharp rise in prices during October. Initial fears that the conflict would spread across the Middle East and disrupt energy supply routes quickly proved to be unfounded, at least in the present moment, and prices steadily fell for the remainder of the month.


As we entered into the winter months, fears of cold weather causing gas shortages had been allayed by healthy supply levels been displayed across Europe. 


As geopolitical news took a back seat, the biggest factor affecting the energy markets became weather, and forecasts were starting to suggest that the worst-case weather scenarios would almost certainly be avoided as the winter would be unlikely to be colder than the average winter.


Wholesale energy prices dropped throughout November, and that continued into December. This led to DA gas prices dropping to 78.45p/therm at the end of the year, the lowest price at the end of a quarter, but still above the low levels seen during the months of May and June. Whereas DA electricity saw the lowest prices of the year come near the end of December before rising slightly to close the year at £60.64/MWh, which was over a £100/MWh decrease from the prices seen at the beginning of January.

The difference in commodity costs for a business with a 1000MWh/year consumption between the start of January and the end of year would be £100,000.  While this is the DA market and not a future's market, we could see than in the market for Winter'24 Electricity there were differences of £30/MWh just between the high point of November and the lowest point in December.  By knowing how to time the market -- or seeking advice from those who have expertise within the market -- shrewd businesses could save themselves thousands or tens of thousands by negotiating their contract at the right time.


By the end of December, fears regarding an unexpectedly cold winter had now almost completely disappeared, and attention drifted back to international conflicts and their ability to affect international supply routes. A narrative that will remain pivotal in the first months of 2024, as it seems prices are likely to stabilise or drop further so long as energy supply routes remain free from disruption.


If you would like our monthly updates and analysis on the energy news that affects UK businesses, then sign up to our newsletter here to receive copies into your inbox, or subscribe to our newsletter on Linkedin to receive notifications whenever we publish our reviews.


12 February 2026
Forecasting annual electricity and gas consumption is one of the most important -- and often underestimated -- stages of the procurement process. While timing the wholesale market and contract structure typically receive the most attention, the accuracy of the consumption forecast can have a large influence on overall energy costs. Suppliers price risk based on expected volumes, network charges are dictated by usage patterns, and internal budgets depend on accurate projections. Without a reliable forecast, organisations expose themselves to avoidable financial and contractual risk. How Consumption Forecasting Works Forecasting begins by analysing historical usage. Half-hourly electricity data, meter reads, and seasonal profiles provide a baseline that shows how a site behaves over time. This historical data is then adjusted to account for known changes, such as production increases, machinery upgrades, operational reductions, or energy efficiency projects. For larger or more complex organisations, forecasting may involve modelling peak demand, load shape, and expected operational shifts across multiple sites. The aim is not simply to estimate an annual total, but to understand when and how energy will be consumed throughout the year. That detail becomes particularly important when selecting contract structures or assessing exposure to network charges. How It Impacts Budgeting Energy often represents a significant operational cost, particularly for manufacturers and other energy-intensive users. Accurate forecasting enables finance teams to build realistic budgets and avoid the shocks of unexpected costs. Reliable forecasts also allow organisations to model different pricing scenarios. Understanding likely consumption enables comparison between fixed contracts and flexible purchasing strategies . It also supports long-term planning by quantifying the financial impact of operational changes or sustainability initiatives.
5 February 2026
Why it’s important your energy bills are in the correct company name For many businesses, energy bills aren’t reviewed with a high-level of scrutiny. As long as the meter is live and the lights stay on, the paperwork often goes unquestioned. However, having electricity and gas bills issued in the correct legal company name is more important than many organisations realise. Failing to ensure that your invoice is correctly addressed can create unnecessary risk and cost. How it can impact your business Energy contracts are signed with a specific legal entity, not a trading name or group brand. If the company name on the bill does not match the Companies House records, the contract may not accurately reflect who is legally responsible for the supply. This can cause problems in the event of disputes with the supplier, changes of tenancy or site ownership, and contract renewal or termination. In some extreme cases, suppliers can refuse to amend or even enforce contracts where the named party is incorrect. Affecting credit checks and pricing Suppliers assess risk using the company name registered on the account. If this is incorrect or outdated: Credit checks may fail or be delayed Higher security deposits may be requested Less competitive pricing may be offered For growing businesses, group structures or recently incorporated entities, this can result in paying more than necessary for energy, simply because the account information isn’t aligned. Delaying contract changes and site updates Something as simple as renewing a contract, adding meters, or updating a supply address can become complicated if the company name is wrong. Common scenarios include: Sites transferred between group companies Trading names used instead of legal names Businesses that have changed structure or ownership Each of these can trigger lengthy data disputes between suppliers, distributors and settlement systems, often delaying changes by weeks or months. Issues with VAT, levies, and exemptions Where VAT exemptions exist, the name on the invoice is required to match the name of the business that has the exemption. There are numerous government schemes that offer businesses relief from specific environmental levies and non-commodity charges . Many of these schemes – such as the British Industry Supercharger – are applied to companies with eligible SIC codes. If the business name is incorrect, then the SIC code cannot be verified and the business may end up missing out on the exemption. Future Contracts When tendering energy contracts, suppliers rely on accurate account data. Incorrect company names can slow down the quoting process, result in quotes being withdrawn, or lead to errors in contracts or start dates. For businesses managing multiple sites, this becomes even more critical. How we help businesses get it right As an energy broker, we regularly see cost and risk created by something as simple as incorrect account information. We help businesses:  Verify company names against Companies House Correct supplier and industry records Manage name changes during restructures or acquisitions If your business requires help with ensuring that your invoices are being issued in the correct name, contact us today and one of our experienced team can assist with all of your energy needs.
5 February 2026
Rising TNUoS and DUOS charges By Adam Novakovic T.S Eliot once said that “April is the cruellest month” and in terms of the prices many businesses pay for their electricity, his quote is prophetically true. While he may not have envisioned rising TNUoS and DUoS costs being the reason for the starkness of the month, for many British businesses, the rise in non-commodity charges that take effect from April 1 st will add unwanted and unneeded extra costs to their energy bills. From the beginning of April, businesses across the UK will see significant increases in two major components of their energy bills: Distribution Use of System (DUoS) and Transmission Network Use of System (TNUoS) charges. These network charges are becoming an increasingly large part of business energy bills -- especially for companies that operate in energy-intensive industries. DUoS & TNUoS, and Why They Matter Both DUoS and TNUoS are network charges applied to electricity bills. As non-commodity charges, they are not related to the cost of energy itself: DUoS charges cover the cost of running, maintaining and reinforcing local distribution networks that carry power to sites. They are paid as a standing charge (in p/day), a capacity charge (in p/kVA/month), and in red/amber/green unit rates – depending on the time of consumption. TNUoS charges fund the high-voltage transmission network operated nationally. This is applied as a standing charge (in p/day). For many businesses, these line items are already making up over a third of their total electricity costs . How these charges change from April 1 st 2026 TNUoS The TNUoS rate that businesses pay is set by NESO (National Energy System Operator). How much a meter is charged per day is dependant on the assigned TCR band . For sites with lower expected consumption, they will be grouped in a lower band, whereas the largest consumers will be in the higher bands and they will be charged more.
1 February 2026
By Adam Novakovic January began with a sense of optimism. The new year brought hopes that energy prices could soon return to levels not seen since 2021, wholesale prices were falling and large quantities of new LNG were scheduled to be available for import during 2026. However, events that transpired during the first 31 days of the year have caused prices to rise and have sent waves of fear throughout the energy markets. The month began with a wave of cold weather leading to above-expected gas consumption. An Arctic blast combined with Storm Goretti brought temperatures down to below -10°C and led to gas power stations being needed to make up the shortfall, causing an uptick in wholesale gas prices.
30 January 2026
What is the Weighted Average Price (WAP) in energy? In the UK energy market, Weighted Average Price (WAP) refers to the average price paid for electricity or gas over a period of time, weighted by the volume bought at each price point. For those on flexible energy contract, the WAP represents what the unit rate will be when multiple purchases were made for the same period. In other words, it answers the question: “What did we actually pay for our energy once all purchases and volumes are taken into account?” This makes WAP far more meaningful than a simple average, especially in volatile markets. How WAP works in practice Energy prices move constantly. Businesses, particularly those on: Flexible contracts Basket or portfolio products Pass-through arrangements often buy energy in multiple tranches at different times and prices. For example: 40% of energy bought at 10.0p/kWh 30% bought at 12.0p/kWh 30% bought at 9.0p/kWh The WAP reflects the price-weighted impact of each purchase, giving a single unit rate that reflectsthe real cost exposure. Why WAP matters to UK businesses 1. It reflects real procurement performance WAP shows how effective your buying strategy has been, not just whether the market went up or down, but how your timing and volumes performed. 2. It’s essential for budgeting and forecasting Using WAP allows businesses to: Accurately forecast energy spend Compare performance year-on-year Avoid misleading headline prices This is especially important for manufacturers and high-consumption sites where small price differences materially impact costs. WAP vs fixed prices Fixed contracts : WAP is locked in at the point of contract Flexible contracts : WAP evolves over time as more volume is bought This means WAP can improve with smart market timing and deteriorate if exposure is unmanaged. For those on fixed contracts, it can be vital that portfolios are being managed by a person or group with experience and expertise in energy markets. Ultimately, the strategy of when and how much to buy is just as important as the market itself. WAP as part of your purchasing strategy Weighted Average Price is the truest reflection of what your business actually pays for energy. Understanding it is critical to controlling cost risk in volatile markets. For larger SMEs and energy-intensive businesses, having a clear energy purchase strategy and having this strategy communicated through regular reporting can be vital for forecasting future energy costs. If your business would like assistance with understanding the current state of your portfolio, or advice on purchasing and management strategies, contact us today to see how we can help lower your electricity and gas costs and help you See More of the hidden value in your energy portfolio.
29 January 2026
Meter types explained (LV, HV and EHV) For many businesses, electricity is treated as a fixed overhead -- something that cannot be changed. But in reality, how your site is connected to the electricity network can significantly influence what you pay , and many organisations are unknowingly on a setup that no longer suits their operations. Whether your supply is Low Voltage (LV), High Voltage (HV) or Extra High Voltage (EHV) impacts network charges, flexibility, and future growth. Understanding the difference could be the key to reducing costs and avoiding any unpleasant surprises. Low Voltage (LV): common, simple — and often overlooked Low Voltage (LV) supplies electricity at up to 1,000 volts and is the most common connection type for SMEs, offices, and retail units. LV customers usually benefit from: Straightforward billing Lower DUOS standing charges Minimal technical involvement However, simplicity can mask inefficiency. As businesses grow, extend operating hours or add energy-intensive equipment, LV sites can find themselves paying disproportionately higher network charges as red and amber unit charges make up a higher percentage of the costs. If your electricity costs have risen faster than your usage, your meter type could be part of the reason. High Voltage (HV): complexity that creates opportunity High Voltage (HV) connections operate between 1,000 and 22,000 volts and are typically used by manufacturers, large warehouses and energy-intensive commercial sites. HV supplies bring: Higher capacity charges Greater exposure to kVA related costs More detailed half-hourly consumption data While this can appear daunting, it also creates opportunity. Businesses that understand how and when they use electricity can actively influence costs, often achieving savings that are simply unavailable at LV. Many HV customers pay for more capacity than they need --or the wrong capacity altogether -- without realising it. Contact us today and we can conduct a kVA review that could potentially save £10,000s annually. Extra High Voltage (EHV): where energy becomes strategic Extra High Voltage (EHV) applies to supplies above 22,000 volts and is reserved for the UK’s largest electricity users. At EHV level: Network charges are highly bespoke Costs are closely linked to site-specific infrastructure Small demand changes can have large financial impacts For these businesses, electricity is not just a utility, it’s a strategic cost driver that requires ongoing oversight. Without regular review and proactive management, EHV sites can sleepwalk into avoidable six-figure cost increases. Why understanding meter type matters Meter type determines: How DUoS and other network charges are applied How much control you have over peak costs Whether your connection aligns with how your site actually operates today Many businesses inherit their meter type and never question it, even when their operations change dramatically. These changes in how a meter operates can require reviews of kVA capacities, meter type, and TCR bands . All of which can help towards reducing energy spend. How we help businesses take control As an energy broker, our role goes far beyond securing competitive unit rates. We help businesses: Understand whether their current meter type still fits Identify inefficiencies hidden within network charges Plan energy strategies that support growth, not restrict it If you’d like to understand whether your LV, HV or EHV supply is working for your business, or quietly working against it, a no-obligation review could uncover meaningful savings and future-proof your energy strategy.
28 January 2026
What are Balancing Services Use of System (BSUoS) charges? Balancing Services Use of System ( BSUoS ) charges recover the cost of keeping the electricity system in balance in real time. Electricity must be generated and consumed at the same moment, and BSUoS funds the actions National Grid Electricity System Operator (NESO) takes to achieve this. These actions include: Instructing generators to increase or decrease output Paying for reserve and response services Managing system constraints and frequency control BSUoS is therefore not about building networks (like TNUoS or DUoS ), but about operating the system safely and securely second-by-second. Who pays BSUoS charges? Since April 2023, BSUoS costs have been recovered entirely from electricity demand rather than split between generators and suppliers. In practice: Suppliers pay BSUoS charges to the system operator These costs are then passed through to all electricity consumers, including business customers Most businesses see BSUoS as a pass-through charge in their supply contracts Domestic customers also contribute, although the charge is typically embedded rather than itemised. How do BSUoS charges work in practice? BSUoS is charged on a per kWh basis, based on actual electricity consumption during each settlement period. The BSUoS rate reflects the real-time cost of balancing the system, which can vary significantly depending on: Weather conditions Generator availability Network constraints Levels of intermittent renewable generation Unlike DUoS or TNUoS, BSUoS is not location-specific. The same rate applies across Great Britain for each settlement period. How much is BSUoS (and when are charges set)? BSUoS charges are not fixed in advance. Instead, they are calculated using a forecast-and-reconciliation model. This means the amount originally charged can be reconciled after the fact once actual consumption data is available. In p/kWh terms, BSUoS charges have varied widely in recent years, but for business customers they have typically fallen in the range of 0.6–1.6 p/kWh, with occasional spikes during periods of market volatility. Because of this variability, BSUoS can be a driver of bill uncertainty for large and flexible users. Why BSUoS matters for businesses As the electricity system becomes more reliant on intermittent renewables, balancing actions are expected to increase. This means BSUoS is likely to remain a material and structurally important cost. For sites with half-hourly metering, reducing consumption during system stress periods -- or using on-site generation and storage -- can help limit exposure, although BSUoS is generally less controllable than DUoS or TNUoS. If you would like to ensure that your BSUoS charges are being invoiced correctly. Contact us today and we can review your recent invoices to make sure you aren't paying more than necessary.
28 January 2026
What are Distribution Use of System (DUoS) charges? Distribution Use of System (DUoS) charges are fees paid for the operation, maintenance and reinforcement of Great Britain’s electricity distribution networks. These networks deliver electricity from the high-voltage transmission system to homes and businesses via lower-voltage local infrastructure. DUoS charges are set and recovered by the Distribution Network Operators (DNOs), which include companies such as UK Power Networks, National Grid Electricity Distribution, and SSE Networks. Who pays DUoS charges? DUoS charges apply to all electricity customers, including domestic and business users. For most businesses, DUoS charges are recovered by the electricity supplier and passed through as a non-commodity network charge. Larger sites connected at higher voltages (HV or EHV) face more complex DUoS tariffs, while smaller sites at low voltage (LV) typically pay lower rates that are embedded in their standing charges. How do DUoS charges work in practice? There are multiple types of DUoS charge: DUoS Standing charge - charged as p/day similar to the traditional standing charge DUoS Capacity charge - charged as p/kVA/month Red / Amber / Green Unit charges - charges depending on when electricity is used. With the Red, Amber, and Green charges, these are based on whether a unit of electricity is consumed during peak or off-peak network hours: Red – the highest of the three charges occurs during peak network demand periods Amber – is applied during intermediate demand periods Green – the lowest of the three charges is for off-peak periods With the capacity charge, this is based on the kVA capacity assigned by the DNO. This charge can be reduced by agreeing with the DNO to lower your kVA capacity. We recommend conducting regular kVA reviews to ensure you are not paying for capacity that you don't use. Contact us today if you would like assistance in conducting a kVA review and potentially saving £10,000s each year on your capacity charges. How much is DUoS (and when are charges set)? DUoS tariffs are set annually by each DNO and apply for the charging year from 1 April to 31 March. Rates vary significantly by region, voltage level and time of use. For non-domestic customers, DUoS can range from 1–2 p/kWh at Low Voltage sites with limited exposure to red periods, or 3–6+ p/kWh (or higher) for High Voltage customers with heavy peak-time usage. As a result of this variability, DUoS is often one of the largest and most volatile network charges on a business electricity bill. Why DUoS matters for businesses DUoS is one of the few bill components that businesses can actively influence. Shifting consumption away from red periods, optimising agreed capacity, or investing in on-site generation or storage can materially reduce costs. DUoS optimisation can deliver immediate and recurring savings , making it a critical focus area in energy cost management. If you would like to check if your capacity charges can be reduced, or that your DUoS charges are being invoiced correctly. Contact us today and we can review your recent invoices to make sure you aren't paying more than necessary.
28 January 2026
What are Transmission Network Use of System (TNUoS) charges? Transmission Network Use of System (TNUoS) charges are fees levied to recover the cost of building, maintaining and operating Great Britain’s electricity transmission network. TNUoS charges ensure that the costs of the transmission system are paid for by those who use it, with larger energy consumers paying the lion's share of the costs. Who pays TNUoS charges? TNUoS charges apply to both electricity generators and electricity users. For most businesses the charge is recovered through their electricity supplier, with TNUoS costs either forming part of the Standing Charge , or being a separate line item. How do TNUoS charges work in practice? The TNUoS charge is a per day amount -- similar to the normal standing charge -- set by the relevant Distribution Network Operator (DNO). The daily rate will vary depending on what TCR band the meter is in, with larger users normally classified as being in a higher TCR band and paying more. However, if you believe your meter has been incorrectly classified and is in the wrong TCR band, it can be reviewed by contacting the DNO. How much is TNUoS (and when are charges set)? TNUoS demand charges are set annually and published ahead of each charging year, which runs from 1 April to 31 March. Unlike policy costs, TNUoS is not charged in p/kWh. Instead, it is levied as a p/day. This can add up to several tens of thousands of pounds per year for high usage meters. With significant investment being made to upgrade the transmission network to accommodate renewable generation, it is likely that TNUoS costs will continue to rise in the coming years, perpetually accounting for a larger proportion of electricity bills. Why TNUoS matters for businesses For high-consumption and flexible sites, TNUoS represents a growing expenditure that is difficult to manage. Some businesses can get relief from the rising TNUoS costs from the Network Charging Compensation mechanism , introduced last year. However, for many businesses, the best they can do is to review that they are in the correct TCR band and are being invoiced correctly by their supplier. If you would like to ensure that you are in the correct TCR band and that your TNUoS charges are being invoiced correctly. Contact us today and we can review your recent invoices to make sure you aren't paying more than necessary.
26 January 2026
What is the Climate Change Levy (CCL)? The Climate Change Levy (CCL) is a UK government tax introduced in 2001 to encourage businesses and the public sector to improve energy efficiency and reduce carbon emissions. Unlike RO , CfDs and FiTs , which fund renewable generation, CCL is a direct tax on energy consumption. CCL applies to the supply of electricity, gas and certain solid fuels used for non-domestic purposes. It is charged per unit of energy consumed, regardless of when or how that energy is used. The levy is administered by HMRC and is designed to create a price signal that incentivises lower energy use and investment in efficiency measures. Who pays the CCL? CCL is payable by non-domestic energy users, including businesses, charities and public sector organisations. Domestic consumers are exempt. Energy suppliers are responsible for collecting the levy and passing it on to HMRC, but the full cost is passed through to customers via energy bills, usually as a clearly identifiable line item. Some organisations may qualify for CCL relief or exemption, most notably: Businesses with a valid Climate Change Agreement (CCA) Certain energy-intensive processes Supplies generated from qualifying renewable sources How much is the CCL (and when are rates revised)? CCL rates are set by the government and are typically revised annually, usually taking effect from 1 April each year. Rates are published by HMRC in advance to allow suppliers to update billing. For both gas and electricity, CCL is charged on a pence per kilowatt hour (p/kWh) basis. The current CCL rates are 0.775p/kWh, set to rise to 0.801p/kWh from April 1st 2026, and then to 0.827p/kWh from April 1st 2027. Unlike RO or CfDs : CCL is not forecast or reconciled There is no recycling or levy adjustment The charge is fixed and unavoidable unless a formal exemption applies Why CCL matters for businesses Because CCL is a straight consumption tax, it directly rewards reduced energy use. Efficiency improvements, on-site generation, and CCA participation can all materially reduce exposure — making CCL one of the few policy costs that businesses can actively manage rather than simply absorb.